<body><script type="text/javascript"> function setAttributeOnload(object, attribute, val) { if(window.addEventListener) { window.addEventListener('load', function(){ object[attribute] = val; }, false); } else { window.attachEvent('onload', function(){ object[attribute] = val; }); } } </script> <div id="navbar-iframe-container"></div> <script type="text/javascript" src="https://apis.google.com/js/platform.js"></script> <script type="text/javascript"> gapi.load("gapi.iframes:gapi.iframes.style.bubble", function() { if (gapi.iframes && gapi.iframes.getContext) { gapi.iframes.getContext().openChild({ url: 'https://www.blogger.com/navbar.g?targetBlogID\x3d13567711\x26blogName\x3dLIS+640/810:+Mapping+community+inform...\x26publishMode\x3dPUBLISH_MODE_BLOGSPOT\x26navbarType\x3dBLUE\x26layoutType\x3dCLASSIC\x26searchRoot\x3dhttps://lis-gis.blogspot.com/search\x26blogLocale\x3den_US\x26v\x3d2\x26homepageUrl\x3dhttp://lis-gis.blogspot.com/\x26vt\x3d7035040351671430127', where: document.getElementById("navbar-iframe-container"), id: "navbar-iframe" }); } }); </script>

Monday, July 31, 2006

WI Atlas selection

I chose "Newest Arrivals" as the most important map for Wisconsin librarians/info professionals to understand. This map shows the locations and percentages of total population for recent immigrants to the state. The two broad groups that are highlighted are Asians and Hispanics, with each group broken down further into national/regional subgroups. Librarians who work in areas with a growing non-English speaking population should consider selecting materials in the native language of people in their communities. ESL materials and programs should also be important parts of public libraries in communities with a growing immigrant population. If a collection is going to be used it needs to reflect the needs of patrons- language, citizenship, adult education, and employment information are all possibly topics of interest to recent immigrants.

Tuesday, July 25, 2006

West Bank Map

I found a map on PBS of new Jewish settler outposts built in the West Bank built between 1996 and 2005. While it isn’t interactive like some of the online maps that were posted, when viewed in conjunction with some of the other features found on the sight it seems it would be useful.

http://www.pbs.org/wgbh/pages/frontline/shows/israel/map/

Maps

This map was disappointing and bad. This map
was a lot more interesting and allowed a viewer to check out a lot of different levels. However, with a number of the maps that I have seen have an issue with legends, be it in understanding them or in simply accessing them.

Monday, July 24, 2006

Wired map

Wired magazine has an "Atlas" section in each month's issue. This consists of a map of some sort (sometimes based on a photo, sometimes on the whole world, sometimes on a specific location) and a set of accompanying facts. The June 2006 Atlas is titled "Where the Cells Are" and it shows a map of all the countries of the world. There are varying colors that indicate a category of national stem cell policies ranging from no official policy to a blanket prohibition on human embryo research. There is also a series of points that show the location of stem cell lines world wide. I like the way this map shows two different pieces of information about the same topic in the same map. The projection of the map seems to address many of the concerns we discussed in class last week, for example Africa is large and Greenland is small. Size is particularly important in a map that illustrates national policies. It is significant to see large geographic areas that have no official policy on an issue of global interest.

Map Critique Summary

This is an interactive map of the wells around Madison, published by the WI State Journal (though I found it on Madison Commons). While it seems much more interactive than the rather simple maps we've been creating with ARCMap, it really is basic. While I love the fact that there is data attached to each point and it is fun to look at, it is missing solid lines of delineation between well districts. Furthermore, several districts get highlighted despite putting the cursor over just one well point. A little frustrating when you're trying to figure out what neighborhoods the wells serve.

My Map

I was so excited to find this map from the New York Times. This is the first interactive map that I have seen from a news source that mimics the GIS which we are learning to use. The “interactive” maps that are typically found on websites such as the NYTimes.com and CNN.com allow you click on states or regions and find out more information than a simple label provides but this map allows you to do so much more! One of my favorite functions of the map is where you can change the view from “State View” to “Population View”. While relative state populations may not provide as insightful in a state election, I feel this function will provide particularly useful come the next federal election. It is also interest to see the voting distict break down for the house of representatives.

Another function of the map that I really like is the question marks in the circles next to some of the statements made on the map. When you click on the question mark you get a qualifier for the statement previously made. For example, next to the layer for “Races to watch” qualifier states, “Races to watch are the crucial contests in this election as decided by the New York Times.” It seems like almost anytime I wanted to say, “Says who?” to the map, an answer was already provided for me.

A third part of the map that I really like is the state by information provided for each state. Not only does the NYTimes give the results of their own research, but they also include local research done on the outcome of the November elections. For Wisconsin, they use polls done by the Capital, for Rhode Island they cite polls done by Brown University and for Florida they give information from two polls done by Qunnipiac University at different point leading up to the election.

In general, I really enjoy the ways that you can manipulate these maps to show the exact information that you are looking for as well as its transparency regarding sources. Also, before finding this, the only other map I could find to post about was Gawker Stalker and really, we should be learning more than how to stalk celebrities with our mapping skills.

Thursday, July 20, 2006

Final project

Meridith and I are working with the Central branch of the Madison Public Library.

1. The guiding questions: Where are the items on the hold shelves going and what genre are they? Ideally this information could help inform the collection development of a particular branch. For example, if a lot of mystery novels were placed on hold and picked up at the Monroe St. Branch, perhaps that could indicate the need for more books of that type at that location.

2. Findings audience: The audience for this project is primarily the Central branch right now, but the data we gather can also be used by the other branches of MPL in their collection development.

3. Examples of data: We will soon be getting a list of addresses (including zip code) and the census block of the patrons who have items on the hold shelves of each branch during a 'snapshot' in the morning. There a some librarians in MPL who are helping us in taking this data and forming it into a workable spreadsheet.

4. Examples of maps to find, ideally: We need maps of Dane County - Madison area in particular - that include census, streets, and a breakdown of the area by zip code.

5. Map manipulations to try: We have been talking with Central about making maps that are broken down by genre in percentages of area. If Ashburn had 30% of its hold shelves filled with graphic novels and Central only had 8%, Ashburn would have a darker/denser shade. This kind of map manipulation means that we would have a number of different maps, one for nearly each genre, excluding nonfiction which we have decided to place into one field. This breakdown would make the maps simpler and easier to understand.

We have connected with Central and have much of the data in a spreadsheet form which we should be able to import into ArcMap, but who knows. One of our concerns is whetther or not all the data will be able to place nicely together.

The two librarians we are working with at MPL were very excited at the prospect of using GIS to interpret data. They both said they were, and I quote here, "jealous" that we were getting to learn this stuff, and that they wished this type of class had been around when they were in library school. Just another indication that GIS will likely be finding its way into more and more libraries.

Wednesday, July 19, 2006

Proposal for Sustain Dane’s Rain Barrel Project Map

Leah Ujda and Lia Vellardita

We are going to create a map for the non-profit Sustain Dane and its Rain Barrel Project in order to help Sustain Dane’s coordinators in planning where rain barrels would be most effective in reducing the effects of non-point source (several sources instead of one direct source) water pollution around Dane County and how to reach people in those areas. The issues at hand in the creation of this map are in showing the people who currently have purchased rain barrels and demographic data about them and how Sustain Dane can identify potential new purchasers.
The map will both represent current purchasers of rain barrels as well as identify pollution and runoff into the lakes and which neighborhoods are closest to said pollution/runoff. The map is for Sustain Dane to use in targeting potential future purchasers according to the water quality around neighborhoods as well as by demographic data, such as which neighborhoods have a higher ratio of homeowners to renters (almost all the buyers of rain barrels have been homeowners so far).
Therefore the following layers will be necessary:
Ø Map of Dane County including streets and water line boundaries (i.e., lakes, rivers, streams, etc)
Ø Map of water pollution and rain water runoff into lakes and rivers in Dane County
Ø Points of current rain barrel purchasers
Ø Demographic data attached to maps showing age, income, homeowner/renter status, education, possible data about car use (to show how open they are to environmentally friendly activities)
Ø How people have found out about the rain barrel project

Since the audience for this map will be Sustain Dane Rain Barrel Project Coordinators, our goal is to create one map that includes all layers and data, then break down and manipulate the layers into several maps highlighting one or two layers. We will be relying upon date supplied by Sustain Dane, demographic information from Census data, and maps of Dane County from various sources (such as the maps provided by ESRI).

Monday, July 17, 2006

Project change

Lia and I planned to work on mapping sections of the bike path in Madison, but it looks like we're going to have to scrap that project. We were unable to contact anyone at BFW who could give us specifics on existing information about the paths, projects they might like to work on, volunteering information, etc.

In our new plan, we are now going to team up with Sustain Dane to create maps relating to their rain barrel project. Some examples of the information that we can work on with them are locations/demographics/neighborhood data for people who have already purchased rain barrels, locations of other "green" businesses or activities in Madison to identify potential new rain barrel participants, and city well information to identify people who are already aware of water issues in the city.

Final Project Update

Today I received the completed set of data that I will need from the Friends of the Library. It turns out only one year of donation data was recorded in an electronic format that will export to ArcView. The records for the other two years are only available to me in print. (Records for this group are kept by three separate offices on campus which has made tracking down this complete info harder than I originally thought.) Because most of the donors are repeats, I don’t think it will take too long to add the needed information to the existing Excel file of the past year’s donors.

I am still looking for a map that has Madison broken down by neighborhood. Barb Dimick mentioned one in her presentation last week, does anyone remember where she said she found it?

Saturday, July 15, 2006

google = reality

I recently moved to Madison. Like any relocation process, the first few weeks involved a lot of figuring stuff out. My list of priorities included: opening a new bank account, buying groceries, obtaining miscellaneous household items, mailing letters and packages to friends, putting some cold beer in the fridge and some decent tequila on the shelf, finding my way to work and around campus, testing out several Mexican restaurants to find my “regular” one, etc. Well … first things last. I need an Internet connection!

Once that was up and running it was smooth sailing. Simple searches like “music stores in Madison” or “sushi near Emerald St.” in Google maps gave me several options, the knowledge to find my way there, and any relevant contact information. In other words, I had an immediate plan of action. All I needed to do was print out a map (or scribble down my own simple version of one) and jump on my bike, armed with the knowledge to navigate my way through an otherwise unfamiliar urban landscape.

Throughout this process I marveled at the usefulness and efficiency of this resource. In the past I was forced to rely on phone books, crude city maps, and confusing directions from locals too familiar with the place to grasp an outsider’s limited perspective. Within just a few days I found such staples of daily existence as a coffee shop, liquor store, and wig emporium (no fly shops in Madison!?). But this appreciation was coupled with another unsettling thought: what if I didn’t have this resource? I’d be completely lost! (insert dramatic music here.)

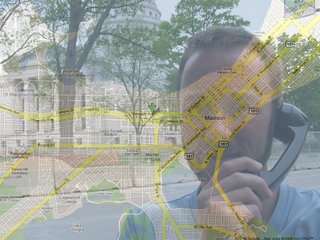
The philosophical implications of this speak to how the use of Google maps informs the development of my geospatial understanding of Madison. I construct a conceptual landscape within my mind before actually experiencing Monroe Street or John Nolen Dr. When actually riding through the streets there is a process of fitting what I experience with what I expect to find … a representational negotiation of sorts. “Oh, here’s where University Ave splits into Campus Dr and University Ave. Here’s that causeway stretching across the corner of Lake Monona.” Sometimes it seems the map is wrong. “Hmm … Exotic George is actually on the corner of Dominion Dr, not Rustic Dr.” But such glaring examples efface a more subtle process by which my virtual understanding of the landscape actually constructs (or constrains?) my experiential understanding of it. The following example attempts to illustrate this point.

I can’t find a local hardware store, so I guess I need to actually drive to Home Depot. Ugh. Oh well, “there it is by the intersection of the W. Beltline Hwy and Verona Rd. So I’m driving and I make the left onto Verona… I’m looking to my right, “the Home Depot is here somewhere…”. I’m exiting to the right. “Oh there it is.” I pull up to it and park. I’m in front of the Home Depot because I am at the place where the map said it’s located. I get out of the car and… “Wait! This isn’t Home Depot. This is some other store. But it can’t be. This must be Home Depot… but it’s not. This is an auto parts store. Something must be wrong with this place. Maybe this neighborhood hasn’t updated itself to fit with the Google map yet?” Turns out Home Depot was there, just behind that store and across a parking lot. But reality was not conforming to my Google-informed mental map. Somehow the virtual representation had superceded the experiential representation of the place. Google >= reality.

Thursday, July 13, 2006

getting in shape

So I downloaded a bunch of files for the Wisconsin counties from the The Census 2000 TIGER/Line (linked from the ESRI site). The data for each county came in its own compressed folder with a shape file, as well as a .dbf and .shx file (which I wasn't really looking for). I had to uncompress each of the 72 folders and copy the shape file into another directory. Is there an easier way in windows? I know with linux/mac i could have a shell script do this!

Anyway, I then imported the shape files into ArcGIS and, lo and behold, up popped the state of Wisconsin with all the counties. Except ... I notice all the counties on the eastern side are not the correct shape. They're stretched horizontally. Is there a problem with the data? Do I need to tweak something in ArcGIS?


Wednesday, July 12, 2006

A lesson in checking your GIS data before you use it to draw conclusions ...

From an article in the NYT today:

It reads like a tally of terrorist targets that a child might have written: Old MacDonald’s Petting Zoo, the Amish Country Popcorn factory, the Mule Day Parade, the Sweetwater Flea Market and an unspecified “Beach at End of a Street.”

But the inspector general of the Department of Homeland Security, in a report released Tuesday, found that the list was not child’s play: all these “unusual or out-of-place” sites “whose criticality is not readily apparent” are inexplicably included in the federal antiterrorism database.

The National Asset Database, as it is known, is so flawed, the inspector general found, that as of January, Indiana, with 8,591 potential terrorist targets, had 50 percent more listed sites than New York (5,687) and more than twice as many as California (3,212), ranking the state the most target-rich place in the nation.

The database is used by the Homeland Security Department to help divvy up the hundreds of millions of dollars in antiterrorism grants each year, including the program announced in May that cut money to New York City and Washington by 40 percent, while significantly increasing spending for cities including Louisville, Ky., and Omaha.

REFERENCE

Eric Lipton, "U.S. Terror Targets: Petting Zoo and Flea Market?" New York Times (12 July 2006).

Tuesday, July 11, 2006

City of Madison Information

Has anyone had any luck finding data (number of households, income, etc.) about Madison broken down by neighborhood? The only census data I can find groups the entire city together and compares it to the rest of the state. Is neigborhood data even kept?

A depressing map

Obesity in America

Monday, July 10, 2006

question about homework

I'm having a bit of a problem with 4-1. I created the new Name field in the revenue table, but when I try to calculate the value of the field I get an error message. This is what I believe the book is telling me to enter for the expression: [MUNICIPA_1]&" "&MUNICIPA_2]. Is this what you guys are doing? Anyone having any better luck?

Link from syllabus?

One of the links on the web syllabus for this weekend's homework is confusing me:

ESRI links

The text pictured is not our text book, and I can't find a password in my text anywhere. Sorry if I'm just spacing out and missing something simple, but I can't see how to get access to the data in this site.

Thanks!

Extended lab hours

Some good news from Michele Besant:

Please let your GIS class members know that we have re-arranged schedules to keep the lab open until 7 on M & W as well as on T & R--this starts today.

The library may not always look open (lights may be out and sign turned to closed) but someone will be here and the side door if not the front door open until 7.

Also the last week of class Shiou will be here Friday (Aug 11) until 7. And that weekend before their project is due, Aug 12 & 13) someone will be here Sat and Sun 12 -5.

Please thank her in person if you see her!

Sunday, July 09, 2006

Sources of information for project

For our bike map project, I've been searching for sources that would include information about local businesses and bike maps. So far, I've found previously created bike maps with the bike paths already listed so we don't have to go out and map a path, which is easy since the City of Madison has such maps on its homepage, and Dane County has a Map for Bicyclists (that isn't as nice as the Madison map). I've found a listing of local businesses in Dane County from the Wisconsin Partners for Sustainability's Buy Local Initiative, that if we use means we'll have to go through the list ourselves and first find Madison businesses and then find the businesses closest to the bike path we are working on. The Bicycle Federation of Wisconsin is also a source information for bike maps.